Registration

Directions


Speaker:

Robert Kabacoff, Ph.D.

Robert Kabacoff

Dr. Kabacoff is a seasoned researcher, with 30 years of experience in data analysis and data visualization.

As Vice President of Research for Management Research Group (1997-present), he consults widely with academic, government, and corporate organizations throughout North America, Western Europe, and the Pacific Rim.  

As a Professor in the Center for Psychological Studies at Nova Southeastern University (1987-1997), he taught numerous graduate courses on multivariate statistics, statistical consulting, and research computing.

Dr. Kabacoff created and maintains the popular tutorial website Quick-R. The second edition of his popular book R in Action: Data Analysis and Graphics with R, is due out this year.

R book cover

R in Action is the first book to present both the R system and the use cases that make it such a compelling package for business developers. The book begins by introducing the R language, including the development environment.

Focusing on practical solutions, the book also offers a crash course in practical statistics and covers elegant methods for dealing with messy and incomplete data using features of R.

With the 2nd edition being released on July 31, you face the quandry of ordering the first edition now, perhaps even before the seminar, or waiting until after the seminar to get the latest version.

I'm told that the author recommends purchasing both...


Printable Flier

Thumbnail for link to printable flier

Why Use R?

If you currently use another statistical package, why learn R?

  1. It's free! If you are a teacher or a student, the benefits are obvious.
  2. It runs on a variety of platforms including Windows, Unix and MacOS.
  3. It provides an unparalleled platform for programming new statistical methods in an easy and straightforward manner.
  4. It contains advanced statistical routines not yet available in other packages.
  5. It has state-of-the-art graphics capabilities.

Obtaining R

R is available for Linux, MacOS X, and Windows (95 or later) platforms. Software can be downloaded from one of the Comprehensive R Archive Network (CRAN) mirror sites.


Why R has a Steep Learning Curve

(Or, why you should attend this seminar!)

Robert Kabacoff notes:

"I have been a hardcore SAS and SPSS programmer for more than 25 years, a Systat programmer for 15 years and a Stata programmer for 2 years. But when I started learning R recently, I found it frustratingly difficult. Why?

I think that there are two reasons why R can be challenging to learn quickly."

First, while there are many introductory tutorials (covering data types, basic commands, the interface), none alone are comprehensive. In part, this is because much of the advanced functionality of R comes from hundreds of user contributed packages. Hunting for what you want can be time consuming, and it can be hard to get a clear overview of what procedures are available.

The second reason is more ephemeral. As users of statistical packages, we tend to run one prescribed procedure for each type of analysis. Think of PROC GLM in SAS. We can carefully set up the run with all the parameters and options that we need. When we run the procedure, the resulting output may be a hundred pages long. We then sift through this output pulling out what we need and discarding the rest.

The paradigm in R is different. Rather than setting up a complete analysis at once, the process is highly interactive. You run a command (say fit a model), take the results and process it through another command (say a set of diagnostic plots), take those results and process it through another command (say cross-validation), etc. The cycle may include transforming the data, and looping back through the whole process again. You stop when you feel that you have fully analyzed the data. It may sound trite, but this reminds me of the paradigm shift from top-down procedural programming to object oriented programming we saw a few years ago. It is not an easy mental shift for many of us to make.

In that in the end, however, I believe that you will feel much more intimately in touch with your data and in control of your work. And it's fun!


R for Software Developers and Data Analysts

When:

June 28, 2014
9:00am - 4:00pm

Where:

Microsoft NERD, Cambridge, MA

Cost:

$179 through May 20
$239 May 21 - June 3
$309 June 4 - June 24
$339 after June 24


Examples of R output graphics

Big Data Analytics

If you are looking at this workshop, you probably have some data that you need to collect, summarize, transform, explore, model, visualize, or present. If so, then R is for you! R has become the world-wide language for statistics, predictive analytics, and data visualization. It offers the widest range of methodologies for understanding data, from the most basic to the most complex and bleeding edge.

One of the hottest topics today is Big Data. Much of the publicity around Big Data focuses on interactive query operations, but the greatest value comes from Big Data Analytics – statistical analysis and visualization of the data.

The R language is widely used for Big Data Analytics, and has become one of the most popular languages for data analysis and visualization in general. Like many popular Big Data tools, R is free software – it is available at no charge under an open source license. This makes R a very attractive tool to learn and use.

R is a complete system. The first challenge with any analysis project is getting the data. R allows you to import data from a variety of sources and then clean, recode and restructure it. Note that in the real world the biggest challenge is making data usable – there are always issues with the data you have to work with!
After importing data, R has many functions for summarizing, modeling, analyzing and graphing data.

Statistical analysis tools include linear and nonlinear modeling, classical statistical test, time series analysis, classification, and clustering as well as other capabilities. Further, R can readily be extended through functions and extensions; the R community is well known for active contributions of many packages.

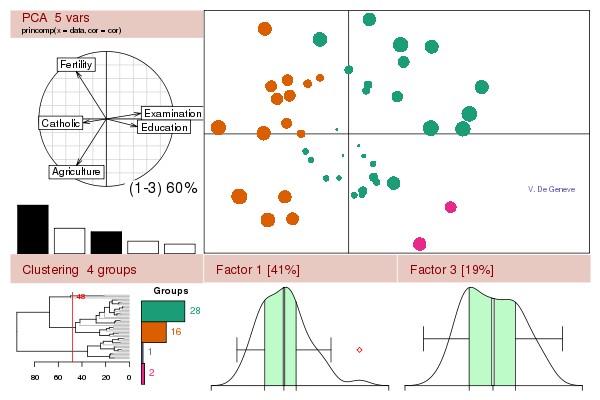
Finally, R has powerful visualization tools. These range from simple charts to publication quality graphs, through dynamic visualization, to interactive graphics. Visualization is key to successful data analytics – it helps the person doing the analysis to better understand the results and is an invaluable tool for explaining the results to others. This may well be the most important aspect of data analytics – providing information that can be used to make decisions.

Join us in this full day seminar and learn from one of the leading authorities on R.


In This Workshop

This workshop will provide a practical introduction to this comprehensive platform.  Participants will learn to import data into R from a variety of sources; clean, recode, and restructure data; and apply R’s many functions for summarizing, modeling, and graphing data. Both basic and more advanced forms of data analysis and graphics will be covered. Additional topics include navigating R’s comprehensive help systems, practical advice for processing data, common programming mistakes to avoid, and useful functions for data mining.

Course Outline

I. Introduction – An introduction to R:  R syntax and data structures; working interactively and in batch; alternative IDEs and GUIs; adding  functionality through packages; common programming mistakes; getting unstuck – where to find answers to your questions.

II. Data Management – Importing, cleaning, and reformatting data:  transforming and recoding variables; subsetting, merging, and aggregating data; control structures; user-written functions.

III. Graphics – Taking advantage of R’s powerful graphics:  creating basic and advanced graphs; customizing and combining graphs; innovative methods for visualizing complex data.

IV. Statistical Analysis and Data Mining – Using R for description, prediction, and classification: descriptive statistics and multi-way tables; ANOVA variants; regression (e.g., linear, logistic, poisson), classification trees, cluster analysis, and other multivariate methods; dealing effectively with missing data; going further.